Many natural and anthropogenic systems can be described based on power law distributions or fractal geometry (i.e., the size of land cover patches, size of forest fires, vegetation patches in a desert, a city's size, and urban properties). Researchers prof. T. Stepinski and A.Dmowska in the paper "Complexity in patterns of racial segregation" published in Chaos, Solitons and Fractals investigate whether the complexity of residential segregation patterns can also be explained by fractal geometry or power law distribution. The analysis is based on racial diversity/dominant race maps for 41 US cities. Such maps consist of many ethnorcial enclaves created by the adjacent same-type cells that form a specific spatio-racial pattern. Authors investigated whether the size of enclaves resembles a power law distribution or a fractal geometry. They found that ethnoracial enclaves have a power law distribution. According to a multifractal analysis, the pattern formed by racial patches is monofractal. The study revealed previously unknown urban systems exhibiting scaling behaviour and a novel tool for exploring racial segregation from a different perspective.
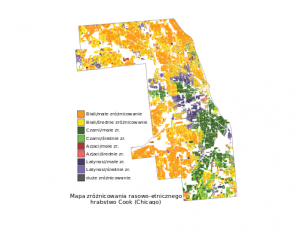
The US urban population is multiracial, but also segregated. It means that ethnoracial groups live in different parts of US major cities. The racial population can be visually depicted by a diversity/dominant race map. It is a map with 13 categories; each category combines dominant race (whites, blacks, Asians, Hispanics), and a diversity level (low, medium, high). For example, a cell classified as low diverse, dominated by whites, represents an area (grid cell) in which whites make up at least 80% of the population. Such maps are part of the SocScape project (http://socscape.edu.pl) and can be viewed for the entire US via the GeoWeb application (http://150.254.124.68/socscape_usa/). A diversity/dominant race map consists of the patches (or ethnoracial enclaves) of different sizes having a class related to one of 13 diversity/dominant race types and located in the different part of the city.
Authors analyze the size of ethnoracial enclaves (measured by population or number of cells) in 41 major US cities in 1990 and 2010. The study aimed to determine whether racial enclave size follows a power low distribution or fractal geometry. The findings reveal that size of enthnoracial enclaves have a heavy-tailed distribution, which either is power law or closely resembles power law. The average value of the exponent is 1.64/1.68 for area/population in 1990 and 1.70/1.74 in 2010. Multifractal analysis of patterns formed by ethnoracial enclaves found that these patterns are monofractal with average values of fractal dimensions in the 0.94-1.81 range depending on racial types and the year of analysis. Fractal geometry of racial pattern indicates that there is a self-similarity of spatio-racial pattern in different scales. Power law distribution of racial patch sizes and a fractal character of racial patterns present observable and quantifiable constraints on models of racial segregation. Authors argue that growth by preferential attachment is a plausible mechanism leading to observed patterns of segregation.